Performance
Backtested performance of the Congress Consensus E2 model
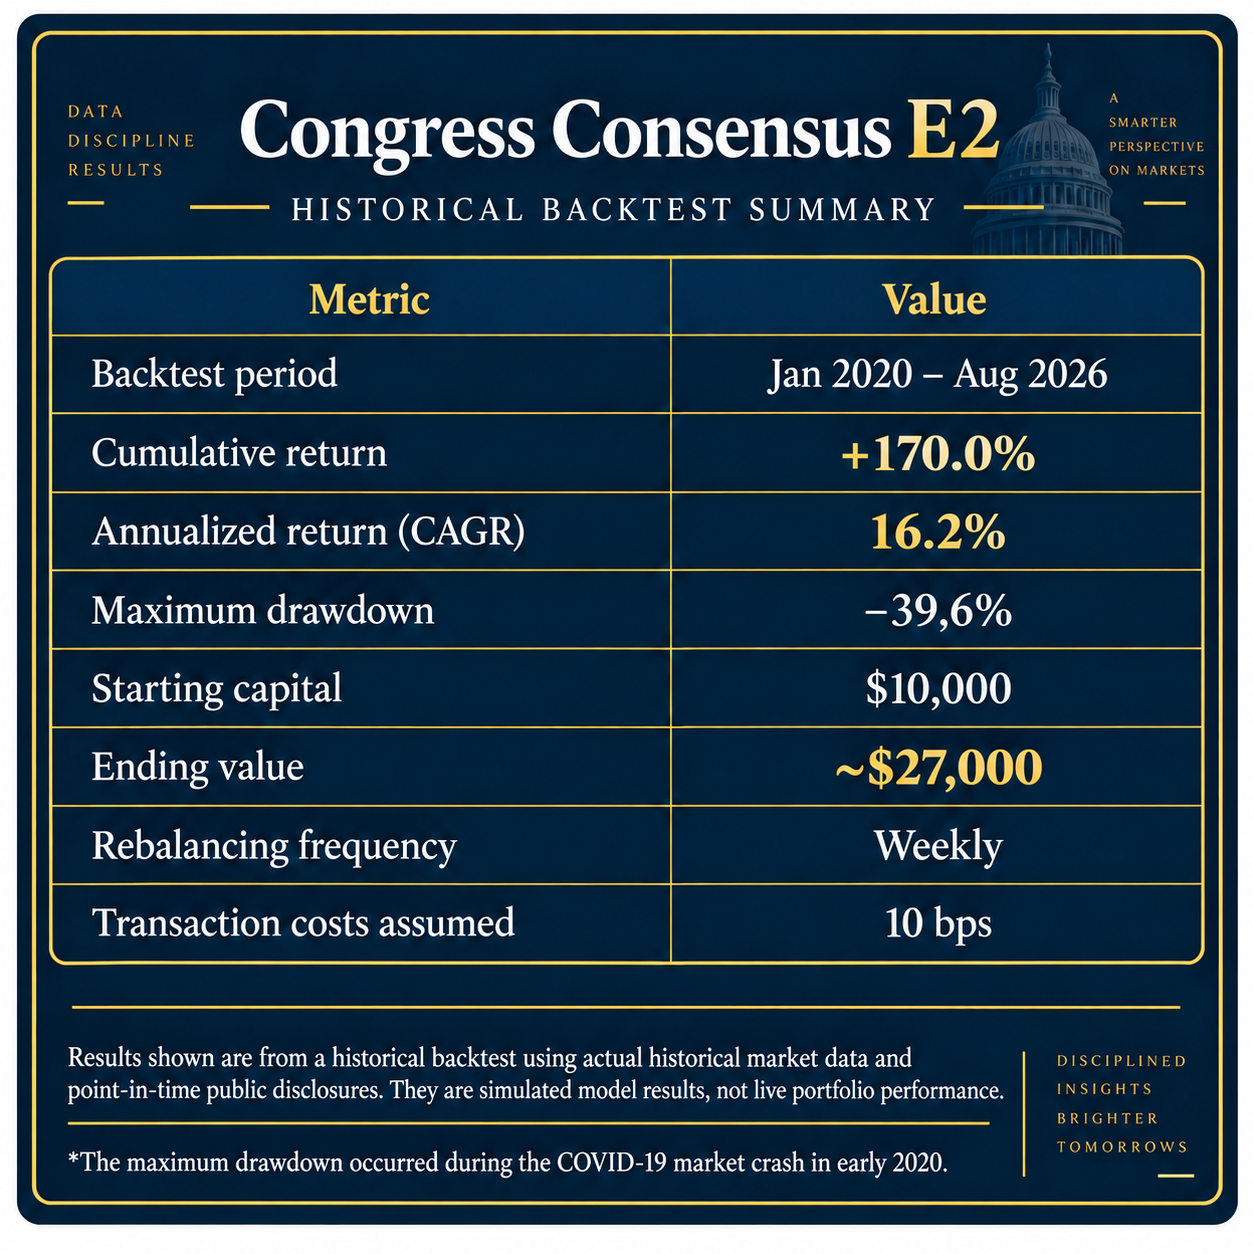
Congress Consensus E2 has been evaluated through point-in-time historical backtesting using actual historical market data and information considered publicly available at the time.
January 2020 – August 2026 · Weekly rebalancing · 10 bps transaction costs · No leverage · No short selling
Congress Consensus E2
Benchmark comparison
Congress Consensus is compared with both the broad U.S. equity market and investable strategies based on congressional trading activity.
The S&P 500 is represented using the dividend-adjusted performance of SPY as a total-return proxy for the broad U.S. equity market.
NANC and GOP provide additional reference points for strategies designed around publicly disclosed congressional trading activity.
Benchmark comparisons are performed over common periods where comparable historical data is available.
All benchmark series are rebased to the same starting point in February 2023, the earliest common comparison period for NANC and GOP.
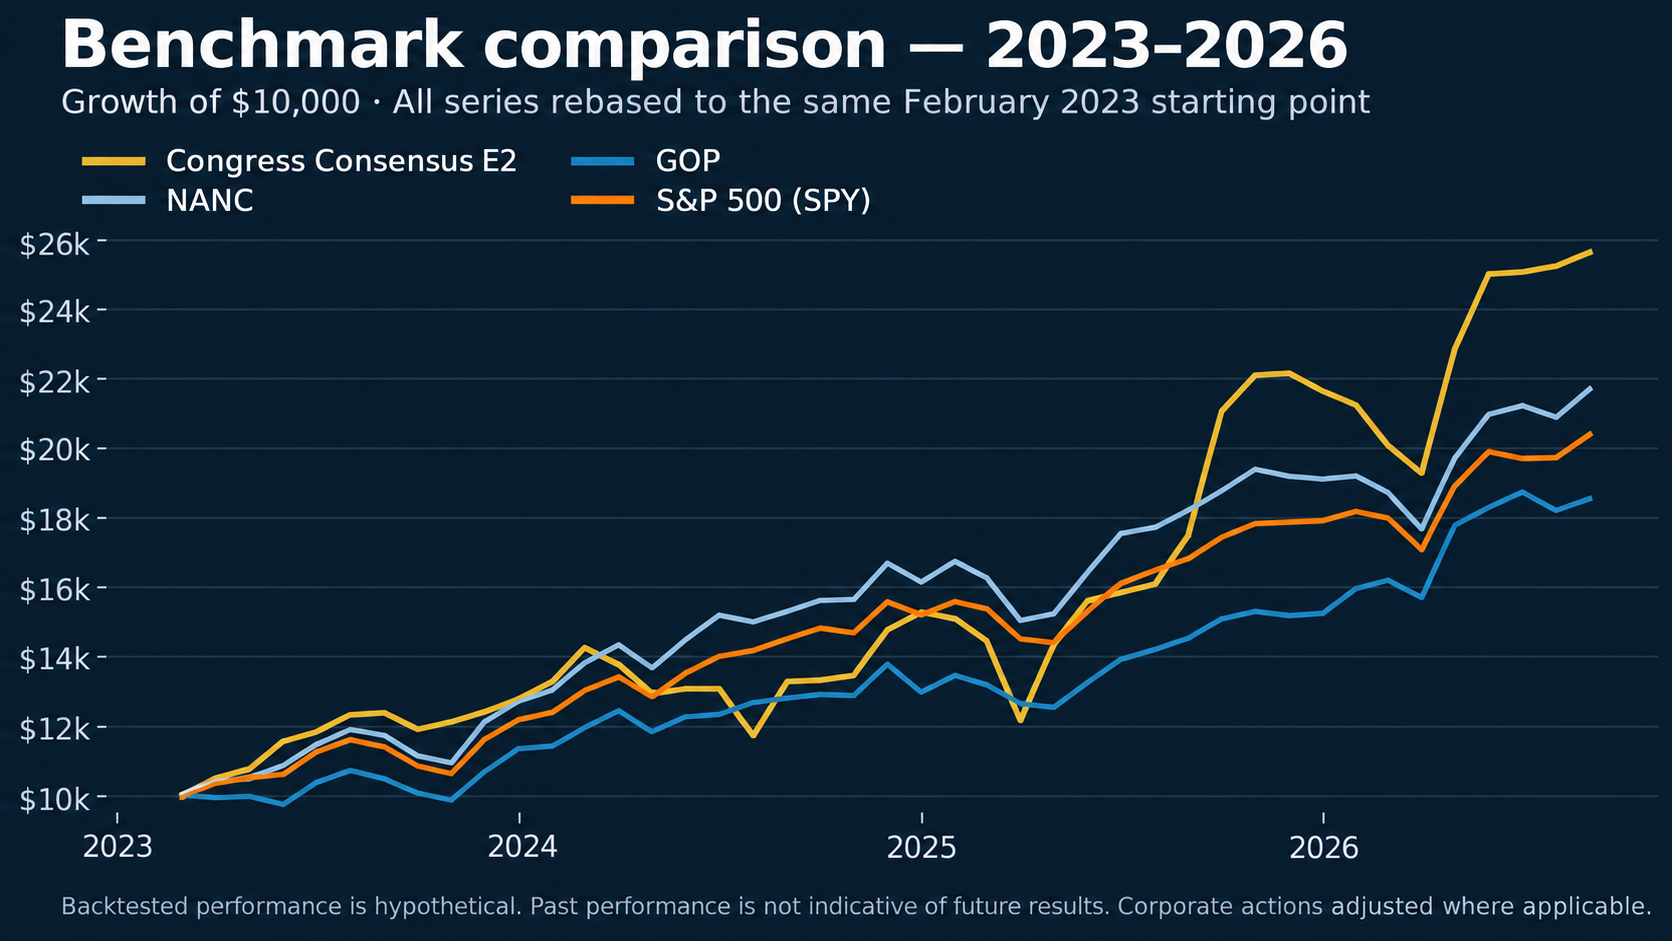
Backtest through August 2026. Congress Consensus E2 results are generated by applying the model to actual historical market data using point-in-time information. They do not represent live portfolio performance
Performance is not uniform
Backtested performance varies over time. The Congress Consensus E2 model has experienced periods of strong performance as well as periods of decline and underperformance.
The full-period result should therefore not be interpreted as a constant or expected rate of return.
Rolling-period analysis shows how the model behaved across different market environments rather than relying on a single start and end date. These results remain historical backtest results and do not represent live investment performance.
Important information
All Congress Consensus performance figures shown on this page are historical backtest results generated from actual historical market data unless explicitly identified otherwise. They do not represent live investment performance.
Backtested performance does not represent the performance of an actual account and is subject to assumptions regarding execution, transaction costs, data availability and portfolio construction.
Historical congressional disclosures may be delayed, amended or incomplete, and some historical securities may not have reliable market data available.
Past performance, including backtested performance, is not indicative of future results.
Live model performance will be tracked separately from the first live Congress Consensus model portfolio publication, using only portfolios and target weights actually published at the time. Backtested and live performance will not be combined into a single continuous performance series.
LIVE PERFORMANCE
Coming soon. Live model performance will begin with the first Congress Consensus portfolio published in real time and will be tracked separately from all historical backtest results.
No live performance data is available yet.
E2 vs S&P 500, NANC & GOP
Published weekly snapshot · Sep 28 (US market open) to Oct 16 (US market close), 2026 · indexed to 100
Published weekly snapshot: the Oct 17 E2 series is fixed for this publication window. SPY is used as the S&P 500 proxy, with NANC and GOP as fixed comparison ETFs for the same dates. All four series are shown as price-only model/benchmark performance, before fees, slippage, dividends, taxes and EUR/USD effects.
Not live brokerage performance. This card is separate from the 2020–2026 historical backtest and from the IBKR account opened Oct 19, 2026. Last included market date: Oct 16, 2026. Static published snapshot — not updated automatically.